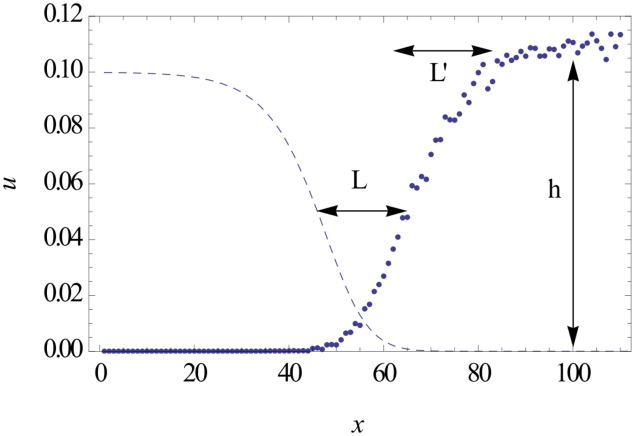
Figure 1. Fixation probability  as a function of the position
  where the mutant is introduced (for
  ,
,  and
and  ).
).
The wildtype wave profile (arbitrarily rescaled) is shown by the dashed line. The probability profile  virtually vanishes in the bulk of the wave, but suddenly rises at a characteristic distance
  from the front, and then saturates. The shape of the function
  is characterized by
  , defined as the distance between the two points at which the curves reach half of their saturation values, by the characteristic width
  over which the curve rises, and by its saturation height
  .
.

