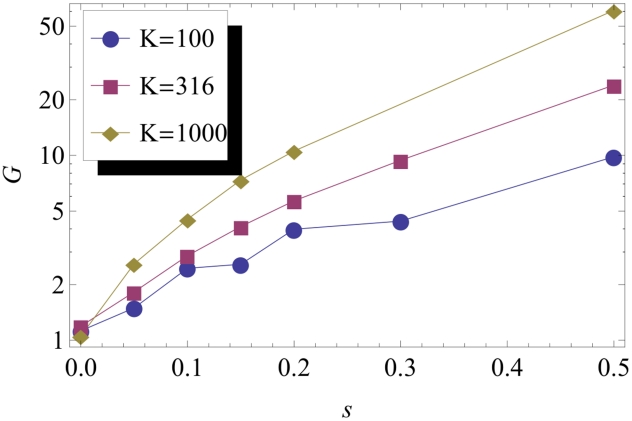
Figure 5. The substitution rate at the front of an advancing population compared to the neutral substitution rate is described by the function  , which is displayed here as a function of the selective advantage of the mutants.
Notice that the  axis is logarithmic. Blue, red and yellow symbols correspond to the carrying capacity
  ,
,  and
and  . All curves approach
  in the neutral case,
  , in which the substitution and mutation rates are equal. Notice the rather slow increase of substitution rates with increasing selection coefficient, for small values of
  : even for
  and the highest carrying capacity, the substitution rates are merely 4 times higher than the neutral baseline, illustrating the ineffectiveness of selection at expanding fronts. For larger selection coefficients, however, the substitution rate grows roughly exponentially with
  .
.

