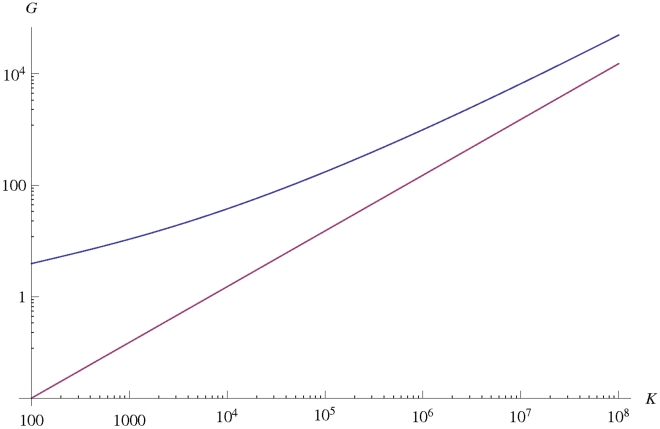
Figure 7. Theoretical approximations for the substitution rate at the front of an advancing population for  ,
,  .
.
The red curve represents the deterministic approximation (24), the blue curve corresponds to the approximation in (26), which accounts for the leading order effects of a finite carrying capacity  . Notice the large enhancement of the substitution rate due to a finite (even if large) value of
  .
.

