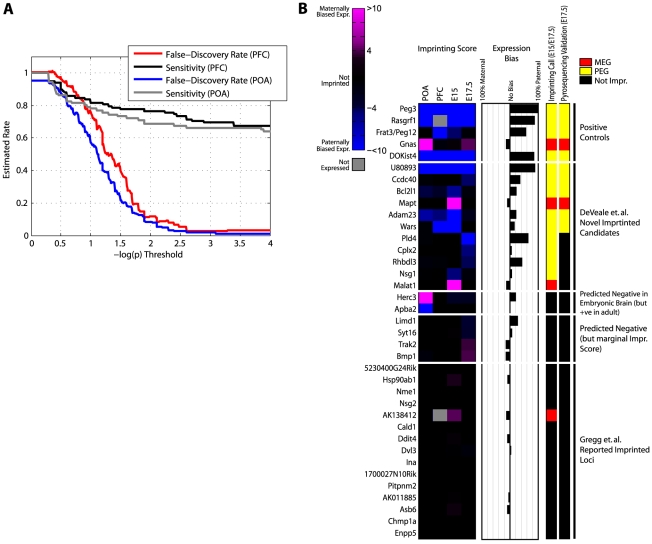
Figure 5. Validating features predictive of genomic imprinting.
(A) Estimated false-discovery rate as a function of p-value threshold. Allele-specific expression counts were summed over all SNPs within each gene. False-discovery was estimated as the number of significant genes in a mock cross (1 versus 3+2 vs 4; see Figure 3A) divided by the number of significant genes in a reciprocal cross (1 versus 4+2 versus 3). Sensitivity was computed as the number of known imprinted genes meeting significance in the reciprocal cross (1 versus 4+2 versus 3) as a fraction of imprinted genes powered for detection (at least one SNP with ≥10 reads in both animals). (B) Imprinting scores (left panel), allelic bias (middle panel), our imprinting call and pyrosequencing call (right panel) for 37 loci tested by pyrosequencing. Imprinting Scores are log10(p), where p is the less significant p-value from chi-square tests performed on the two reciprocal crosses; negatives arbitrarily represent paternal bias. Expression bias is the allelic bias measured in RNA-Seq data from the average of embryonic brain data (E15/E17.5). Imprinting call is based on an imprinting score threshold of 4 (p<1e-4) in E15 and/or E17.5 brains. Pyrosequencing validation was done on total RNA from E17.5 brains and calibrated on biological replicates (see Materials and Methods for details). Imprinted Loci reported by Gregg et al. represent 17 randomly selected SNPs reported imprinted in E15 [17].

