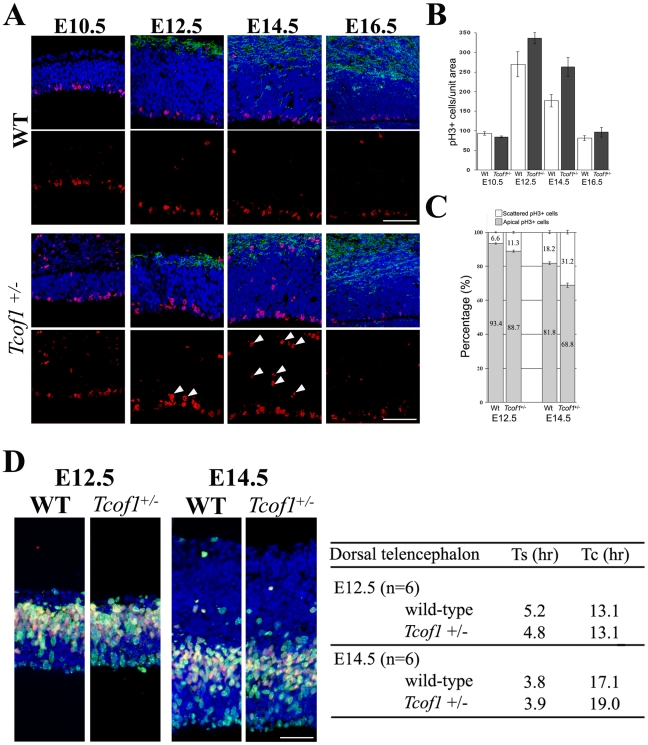
Figure 4. Neural progenitor cells in Tcof1 +/− embryos exhibit mitotic defects.
(A) Immunostaining of E10.5–E16.5 embryonic forebrains using a pH 3 antibody (red). Arrowheads indicate scattered progenitor cells in the ventricular and subventricular zones of the telencephalon in E14.5 Tcof1 +/− embryos. The neuron layers were visualized by immunofluorescence of anti-MAP2 antibody (green). (B) Bar graph depicting average numbers of mitotic cells in the telencephalon of E10.5–E16.5 wild-type and Tcof1 +/− embryos, counted in a unit section of 100 µm width. (C) Bar graph depicting the percentage of apical neural progenitor cells and abnormal scattered neural progenitor cells in the telencephalon of E12.5 and E14.5 wild-type and Tcof1 +/− embryos. (D) Co-labeling of the telencehalon in wild-type and Tcof1 mutant embryos with IdU (green) and BrdU (red). S-phase and total cell cycle length were estimated by the number of IdU- and BrdU-positive cells and revealed an increase in total cell cycle length in Tcof1 +/− embryos compared to wild-type littermates. Scale Bars: A and D, 50 µm.

