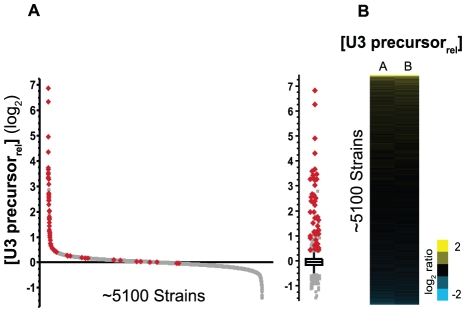
Figure 1. A subset of gene disruptions causes an increase in the unspliced levels of U3 snoRNA.
A. The relative level of U3 snoRNA precursor in 5122 strains, ordered from the highest to lowest. Red data points highlight the strains containing mutations in a factor within the GO PROCESS: RNA Splicing category (see Figure S1). To the right, a box and outlier plot for the same dataset. B. False color representation of both the A (left) and B (right) biological replicates. The values are ordered from high to low, mirroring the data in (A).

