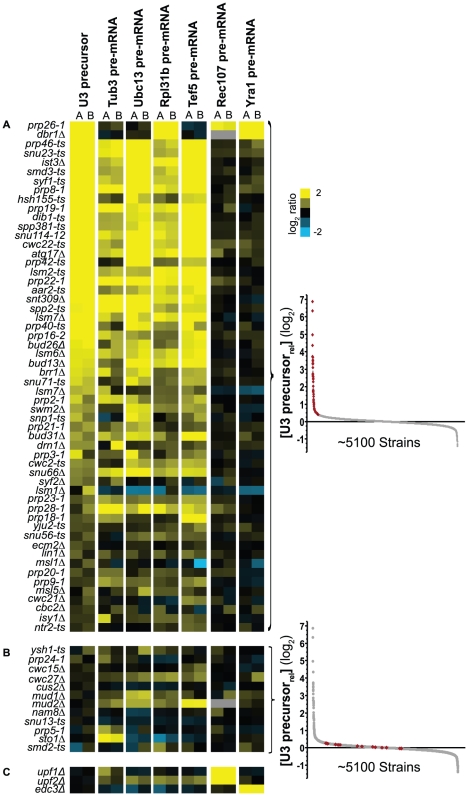
Figure 3. Mutations in most known splicing factors lead to increased precursor levels of canonical splicing substrates.
Relative levels of the indicated RNAs are shown in the background of all strains containing mutations in known splicing factors. The biological replicates (A and B) are shown for each RNA. Precursor levels for all transcripts are ordered based on the average expression values of U3 precursor, from high to low values. Gene disruptions are indicated on the left (-ts indicates a temperature sensitive allele). Insets to right indicate the location of the data in the U3 precursor dataset. A. Mutations that lead to an increase in the U3 snoRNA. B. Mutations that do not affect U3 precursor levels but may affect the levels of other intron containing genes. C. The increase of Rec107 precursor levels seen in the ufp1Δ and upf2Δ backgrounds, and the increase of Yra1 precursor levels seen in the edc3Δ background are consistent with their well-characterized degradation pathways.

