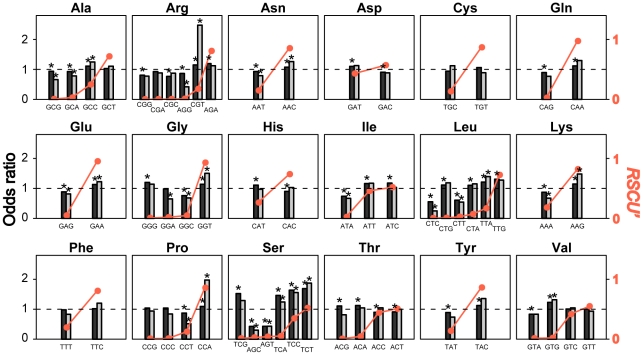
Figure 8. Matches and mismatches between preferred codons and accurate codons in S. cerevisiae.
Odds ratio (bars) measures the enrichment of a synonymous codon at evolutionarily conserved amino acid residues relative to that at non-conserved residues and is used as a proxy for translational accuracy. RSCU' (orange dots) measures the preference in codon usage. Odds ratios are estimated from either all genes (black) or the 10% most highly expressed genes (grey) of S. cerevisiae. Asterisks indicate 5% significance in the deviation of an odds ratio from 1 (uncorrected for multiple testing).

