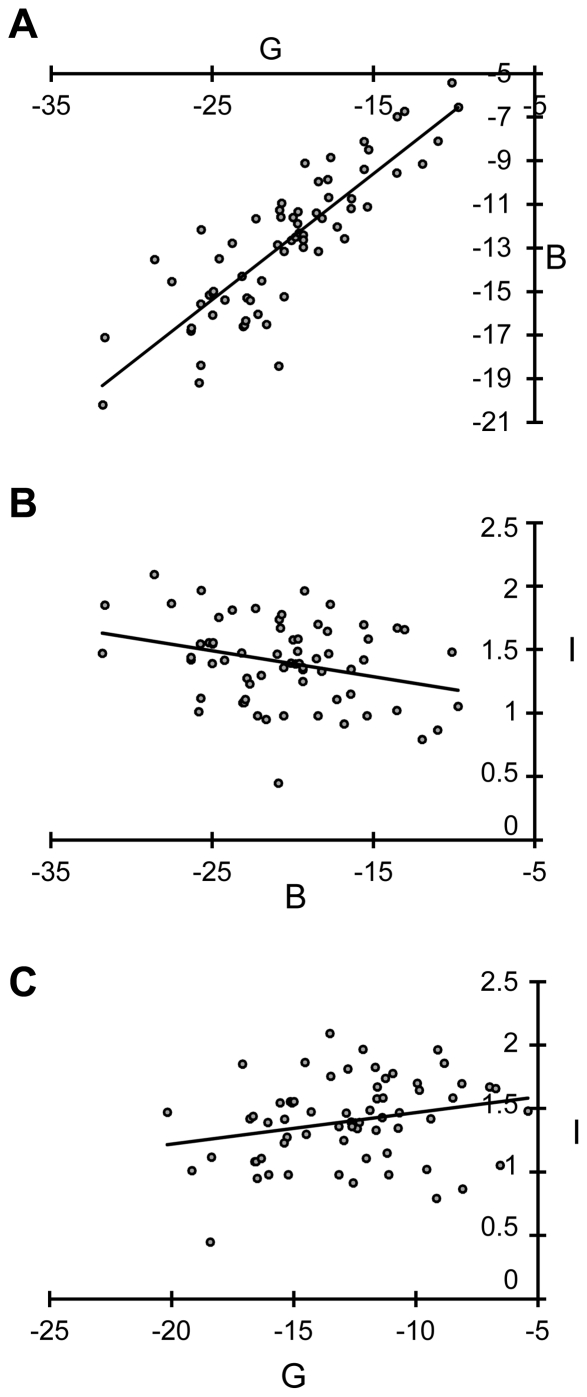
Figure 3. Graphic representations of correlation between the variables B, G, and I after Box-Cox transformation.
Gentamicin-induced readthrough level is plotted against basal readthrough level (A); the factor of increase is plotted against basal readthrough level (B) and against gentamicin-induced readthrough level (C). Bravais-Pearson tests were performed to analyze the correlations between the three variables after Box-Cox transformation. Statistically significant results are indicated in Table S4.

