
FIGURE 4.
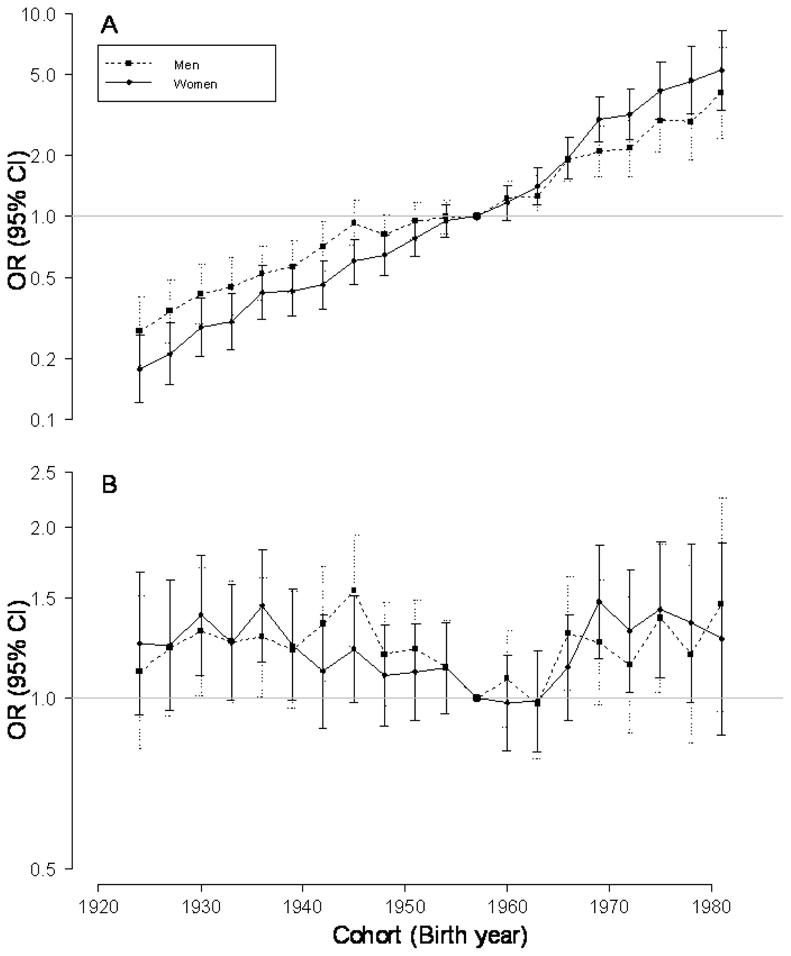
Odds Ratios (pointwise 95% confidence intervals) for birth cohort effect on obesity prevalence in reference to the cohort born in 1957, in the year 1997 (reference survey period), in men and women. A., combined drift and nonlinear effect and B., nonlinear effect.