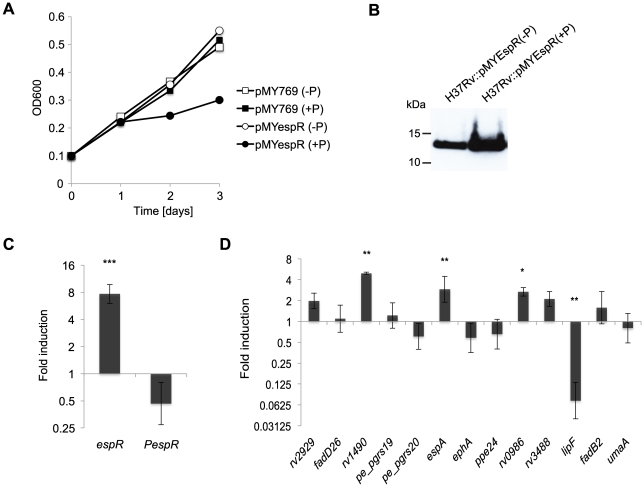
Figure 4. Gene expression associated with EspR binding.
(A) Growth of H37Rv::pMYespR without (−P) or with (+P) pristinamycin IA. Growth was monitored at the designated time points measuring OD600. (B) Immunoblot analysis of EspR expression in the absence (−P) or presence (+P) of pristinamycin IA after 3 days growth using rat polyclonal antibodies specific for EspR. Equivalent amounts of total protein lysates were loaded. (C, D) Quantitative RT-PCR analysis of relative mRNA levels extracted from H37Rv::pMYespR cells treated with 0 µg/ml or 2 µg/ml of pristinamycin using primers specific for the following regions: (C) the espR coding region (annealing to both endogenous and vector copies of espR) or to the 5′-UTR region of espR (PespR) (specific to endogenous espR). (D) The coding regions of genes related to the top 10 EspR binding peaks as obtained in ChIP-Seq experiments (see Table 1). Relative gene expression was normalized against sigA and displayed as fold-induction (log-2 scale) relative to the untreated sample (0 µg/ml pristinamycin). Shown are the mean ± s.d. of a minimum of duplicate measurements from the average of three independent experiments. Statistical significance was evaluated using Students T-test. * indicates P<0.05, ** P<0.01 and *** P<0.001.

