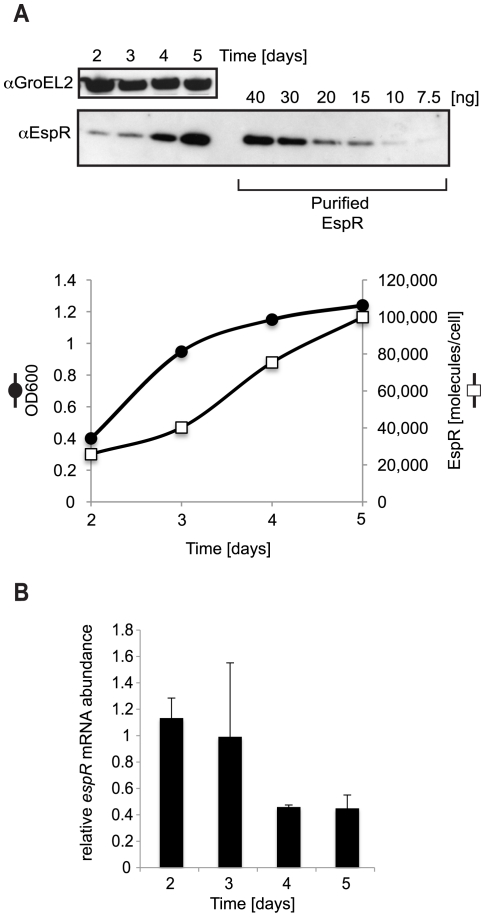
Figure 5. Growth phase-dependent variation of EspR intracellular levels.
Time course analysis of Mtb H37Rv at the following phases of growth: early log (day 2), mid-log (day 3) and stationary (days 4 and 5). (A) Immunoblot analysis of cell lysates (CL) from equivalent amount of cells (approx. 2*10∧7). For quantification purposes, the indicated amounts of purified EspR were electroblotted onto the same membrane as cell lysates. GroEL2 is used as a loading control and corresponding Western blot signals are used to normalize small loading discrepancies. The number of EspR molecules per cell was estimated from Western blot analysis correlated to OD600 measurements, assuming that OD600 0.2 = 108 cells [40]. The results are plotted in the bottom chart, with solid circles representing optical density at 600 nm (OD600) while open squares represent the total number of EspR molecules per cell from one representative of four experiments. (B) Relative espR transcript amounts measured in total RNA harvested at the different time points by quantitative RT-PCR and normalized to sigA expression. The means and standard deviations of triplicate measurements are shown from two experiments.

