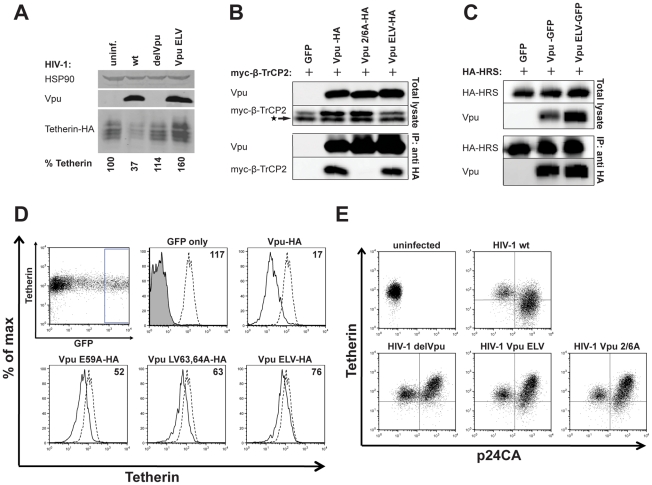
Figure 2. Vpu ELV mutants are defective for tetherin degradation and cell-surface downregulation.
(A) HT1080 cells stably expressing tetherin-HA were infected with VSV-G-pseudotyped HIV-1 wt, HIV-1 delVpu or HIV-1 Vpu ELV at an MOI of 2. 48 h post infection, cells were harvested and subjected to SDS-PAGE and analyzed by Western blotting for tetherin-HA, Vpu and Hsp90, and analyzed by LiCor quantitative imager. Relative tetherin-HA levels are indicated below each lane. The blot shown is a representative example of 3 independent experiments. (B) 293T cells were transfected with pCR3.1 Vpu-HA, Vpu 2/6A-HA, or Vpu ELV-HA in combination with pCR3.1 myc-β-TrCP2. 48 h post transfection, cells were lysed and immunoprecipitated with anti-HA antibody. Lysates and precipitates were subjected to SDS-PAGE and analyzed by Western blotting for Vpu and myc-β-TrCP2, and analyzed by ImageQuant. The star represents an unspecific band. (C) Similarly, 293T cells were transfected with pCR3.1 HA-HRS in combination with Vpu-GFP or Vpu ELV-GFP expression constructs. Cell lysates were precipitated with an anti-HA antibody and analyzed as in C. (D) HeLa cells were co-transfected with pCR3.1 Vpu-HA or indicated Vpu mutant in combination with a GFP expression construct. Cell surface staining for endogenous tetherin was analyzed by flow cytometry 48 h post transfection. GFP positive cells were gated and tetherin levels (solid lines) were compared to those of untransfected HeLa cells (dotted lines). Numbers indicate median fluorescence intensities of surface tetherin on transfected cells. The solid peak in the upper middle histogram represents the binding of the isotype control. (E) Jurkat cells were infected with VSV-G-pseudotyped HIV-1 wt, HIV-1 delVpu, HIV-1 Vpu ELV or HIV-1 Vpu 2/6A at an MOI of 1. 48 h post infection, cells were stained for cell surface tetherin and intracellular p24CA, and analyzed by flow cytometry. Productively infected cells were identified by comparing with culture infected with the same MOI in the presence of 50 µM AZT to control for p24CA uptake of the inoculum (Figure S1C).

