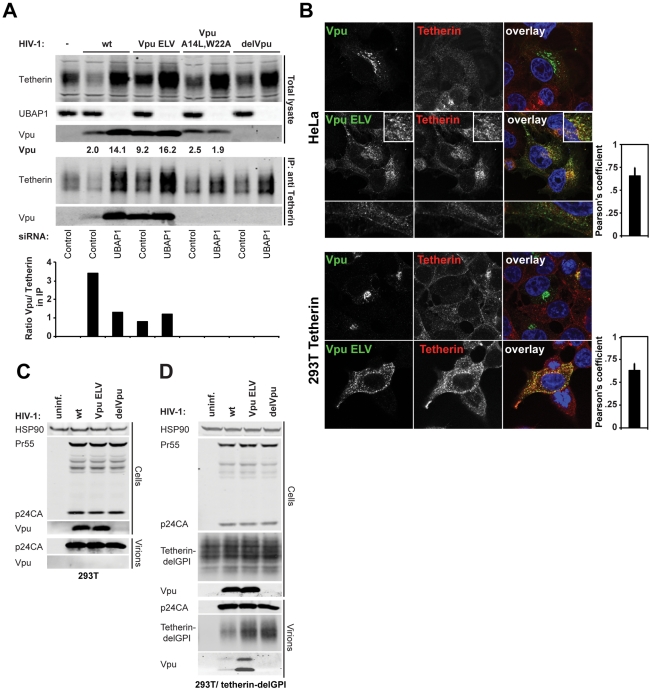
Figure 4. Vpu ELV interacts and colocalizes with tetherin, and is incorporated into nascent virions.
(A) 293T/tetherin cells were transfected twice over 48 h with siRNA oligonucleotide directed against UBAP1 or Non-targeting control. The cells were then infected with the indicated virus at an MOI of 2. 48 h later cell lysates were immunoprecipitated with an anti-tetherin monoclonal antibody. Lysates and immunoprecipitates were separated by SDS-PAGE and blotted for tetherin, UBAP1 or Vpu using LiCor quantitative Western blotting. Numbers under the Vpu lanes of the cell lysate represent relative band intensities. The histogram below the IP represents the ratio of tetherin band intensity to that of Vpu in the co-IP. (B) HeLa and 293T/tetherin cells were infected as in Figure 3 and stained for Vpu (green) and tetherin (red) and examined by confocal microscopy. Adjacent histograms quantify the degree of co-localization of Vpu ELV and tetherin (Pearson's Correlation Coefficient calculated using ImageJ) for 20 individual cells. (C) and (D) 293T or 293T cells stably expressing tetherin delGPI were infected with HIV-1 wt, HIV-1 Vpu ELV or HIV-1 delVpu at an MOI of 1. 48 h post infection, cells were harvested and viral supernatants were pelleted through a 20% sucrose cushion. Cells and virions were subjected to SDS-PAGE and Western blotting for tetherin delGPI, Vpu, HIV-1 p24CA and Hsp90 and analyzed by LiCor quantitative imager.

