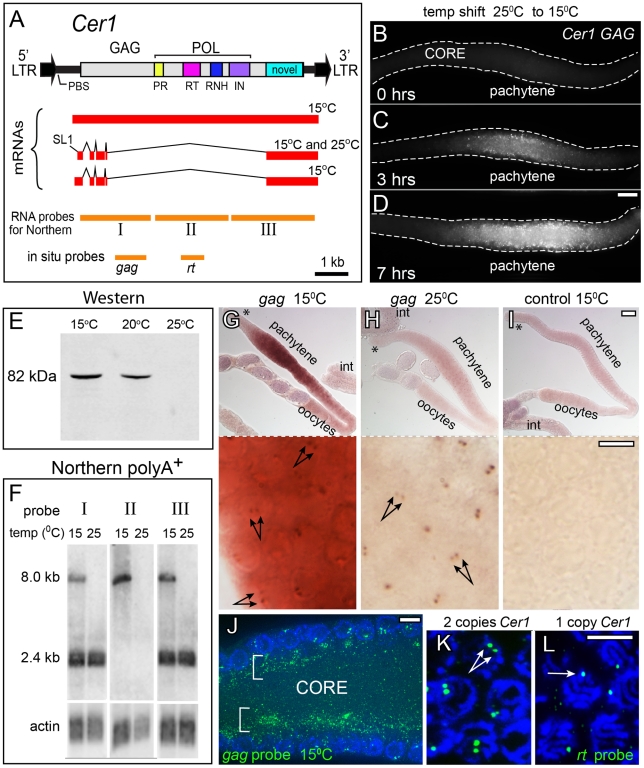
Figure 2. Cer1 GAG expression is temperature dependent.
(A) Diagram of the Cer1 retrotransposon, mRNA products confirmed by sequencing in this study, and the locations of probes used for Northern and in situ experiments. Colored boxes within POL correspond to homology regions for Protease (PR), Reverse Transcriptase (RT), Ribonuclease H (RNH), and Integrase (IN) as described [30]. mRNAs beginning 5′ to the splice acceptor used for SL1 trans-splicing were demonstrated by RT-PCR using primer pairs KE409F, KE416R and KE409F, KE401BR (Materials and Methods). (B–D) Gonads immunostained with αGAG; gonads were dissected from day 1 adults raised at 25°C, then shifted to 15°C for the times indicated. (E) Western blot of total proteins from adults grown at either 15°C, 20°C, or 25°C; blots were stained with αGAG. (F) Northern blots of poly(A)+-selected RNA from adults grown at either 15°C or 25°C; blots were hybridized with probes (I–III) as diagrammed in panel A. Normalization relative to a control actin probe showed that the difference in signal between 15°C and 25°C is at least tenfold for the 8 kb band. (G–I) RNA in situ hybridization (alkaline phosphatase detection) of gonads and intestines (int) from adults cultured at the indicated temperatures, using probes for sense or antisense (control) gag-containing mRNA; each asterisk indicates the distal, mitotic region of the gonad. Bottom panels are higher magnifications of the same gonads showing gag-containing RNA concentrated in paired, nuclear dots (double arrows). (J) Fluorescence in situ hybridization (FISH) of a 15°C gonad using the gag-specific probe (green); the image shows a longitudinal, optical section through the gonad core. Note that RNA is concentrated in the superapical region of the core (brackets), and in paired dots within nuclei (blue, DAPI). (K–L) High magnification of FISH with the rt-specific probe; images show two nuclear dots in wild-type germ cells (panel K, two copies of Cer1) and one dot in nuclei from N2/CB4856 heterozygotes (panel L, one copy of Cer1); control CB4856 homozygotes which lack Cer1 show no staining (data not shown). Scale bars: B–D (20 µm); G–I (20 µm), inserts (5 µm); J–L(5 µm).

