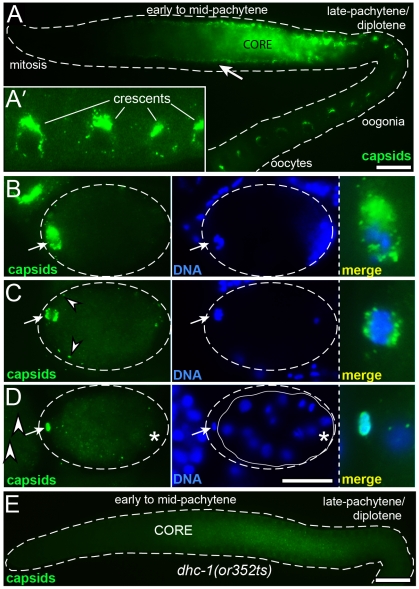
Figure 3. Cer1 capsids show stage-specific changes in localization.
(A) Low magnification, wide-field image of a gonad from a 15°C adult, immunostained with αGAG to detect Cer1 capsids (green). Note that capsids in the mid-pachytene region are enriched along the superapical zone of the core (compare with Figure 2J), rather than within germ cells at the periphery (arrow). (A′) High magnification showing the crescent-shaped aggregates of capsids by oogonia nuclei. (B,C) Newly fertilized eggs showing the maternal chromosomes at diakinesis (B), and at metaphase of the meiosis I division (C). Arrows point to concentrations of capsids associated with the meiosis I spindle, and arrowheads indicate small foci of capsids at the periphery. The examples shown for these images contain unusually high numbers of capsids; most eggs show the same localization pattern but with fewer capsids, and many fertilized eggs contain no detectable capsids. (D) 28-cell stage embryo; the arrow points to capsids within the first polar body. The asterisk is below the germ cell precursor, showing that capsids do not concentrate in this cell. The eggshell is outlined in panels B–C (dashed line), and the cellular boundary of the 28-cell embryo is indicated in panel D (white line). (E) Capsid localization in a dhc-1/dynein mutant; this gonad was scored as “+” in Table 3. Scale bars: A–E (20 µm).

