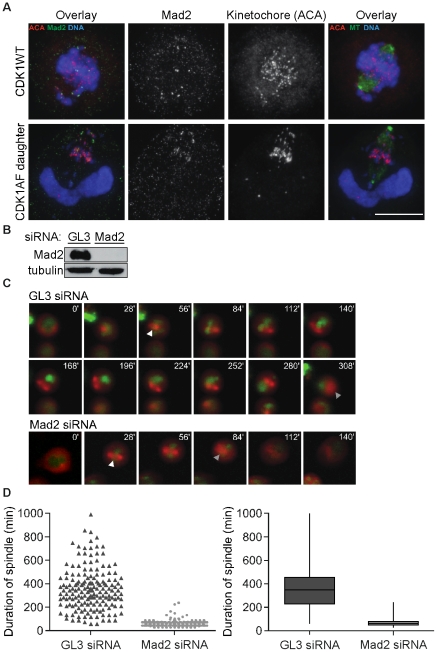
Figure 4. Mad2 stabilizes prematurely formed spindles in M-phase-like G1 cells.
(A) Mad2 (green) with kinetochores (ACA; magenta) and DNA (blue) (left), or their overlay of MT (green) and DNA with kinetochores (ACA; magenta) (right) in a representative CDK1WT mitotic cell (top) and daughter produced by division of a CDK1AF-expresser (bottom). Scale bar = 10 µM. (B) Mad2 (top) and tubulin (bottom) immunoblots in a cell line stably expressing histone H2B-GFP (green) and mCherry-α-tubulin (red), following co-transfection with CFP-CDK1AF and Diced siRNA pools to firefly luciferase (GL3) or human Mad2 3′ UTR. (C) Montage of live-cell images from transfections described in (B) showing a representative GL3 d-siRNA-treated cell (top) and Mad2 d-siRNA-treated cell (bottom). White arrowheads indicate prematurely formed spindle; gray arrowheads indicate last image of apparent spindle structure. (D) Scatter plot of spindle duration times for CDK1AF/GL3-siRNA (dark gray) and CDK1AF/Mad2-siRNA (light gray) co-transfected cells (left) and box plot (right). Transfections and imaging were performed in triplicate (N = 3; nGL3 and nMad2 = 167 representative cells). GL3-siRNA spindle duration: range, 60–990 min; first quartile, 225 min; median 345 min; third quartile, 450 min. Mad2-siRNA spindle duration: range, 30–240 min; first quartile, 45 min, median, 60 min; third quartile, 75 min.

