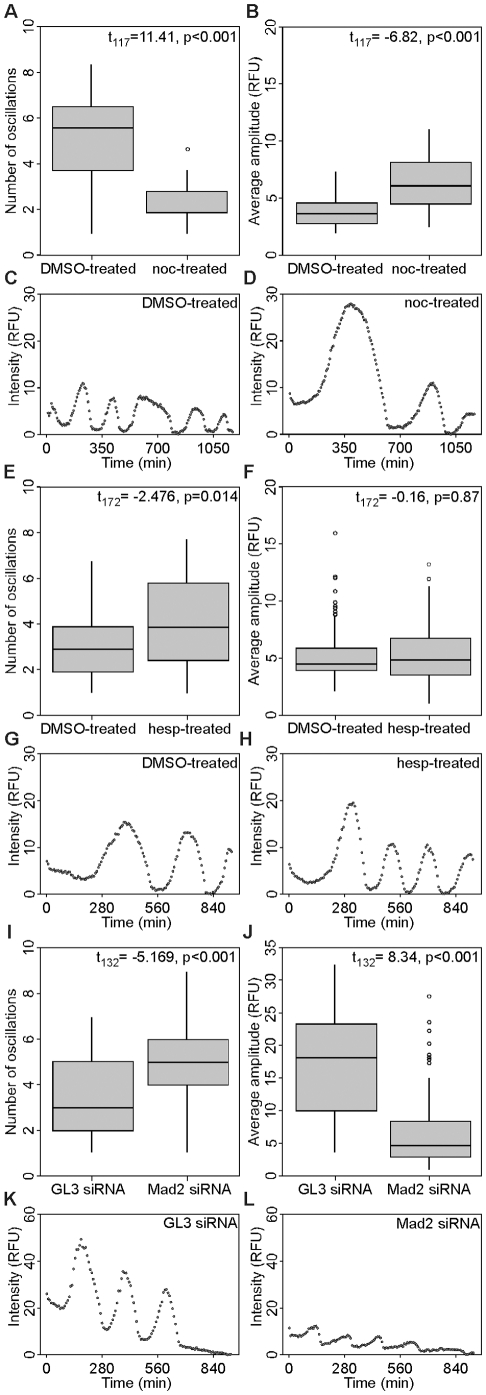
Figure 5. Mad2 knockdown in G1 cells with impaired APC-Cdh1 activity increases cyclin B1-YFP oscillation frequency.
(A) Box plots of cyclin B1-YFP oscillation peak frequencies in DMSO- and nocodazole-treated cells, respectively. DMSO (oscillations per experiment (OPE)): range, 0.92–8.35; first quartile, 3.71; median, 5.56, third quartile, 6.49. Nocodazole (OPE): range, 0.92–3.71; first quartile, 1.85; median, 1.85; third quartile, 2.78. (B) Box plots of cyclin B1-YFP oscillation amplitudes in DMSO- and nocodazole-treated cells, respectively. DMSO (relative fluorescence units (RFU)): range, 1.9–7.3; first quartile, 2.7; median, 3.6, third quartile, 4.5. Nocodazole (RFU): range, 2.4–10.9; first quartile, 4.4; median, 6.0; third quartile, 8.1. (C, D) Representative cells oscillating at the median frequency in the DMSO and nocodazole treatments, respectively. (E) Box plots of cyclin B1-YFP oscillation peak frequencies in DMSO- and hesperadin-treated cells. DMSO (OPE): range, 0.96–6.74; first quartile, 1.92; median, 2.88, third quartile, 3.85. Hesperadin (OPE): range, 0.96–7.7; first quartile, 2.4; median, 3.85; third quartile, 5.77. (F) Box plots of cyclin B1-YFP oscillation amplitudes in DMSO- and hesperadin-treated cells, respectively. DMSO (RFU): range, 2.0–8.5; first quartile, 3.9; median, 4.4, third quartile, 5.8. Hesperadin (RFU): range, 1.0–11.2; first quartile, 3.5; median, 4.8; third quartile, 6.6. (G, H) Representative cells oscillating at median frequency in the DMSO and hesperadin treatments, respectively. (I) Box plots of cyclin B1-YFP oscillation peak frequencies in GL3- and Mad2 d-siRNA-treated cells. GL3 (OPE): range, 0.99–6.94; first quartile, 1.98; median, 2.97, third quartile, 4.96. Mad2 (OPE): range, 0.99–8.92; first quartile, 3.96; median, 4.96; third quartile, 5.95. (J) Box plots of cyclin B1-YFP oscillation amplitudes in GL3- and Mad2 d-siRNA-treated cells, respectively. GL3 (RFU): range, 3.5–32.4; first quartile, 9.9; median, 18.0, third quartile, 23.2. Mad2 (RFU): range, 0.9–14.9; first quartile, 2.9; median, 6.9; third quartile, 8.3. (K, L) Representative cells oscillating at median frequency in the GL3- and Mad2-d-siRNA treatments, respectively. In (A), (F), and (J), outliers that are at least 1.5 times the interquartile distance away from their respective quartiles are presented as circles.

