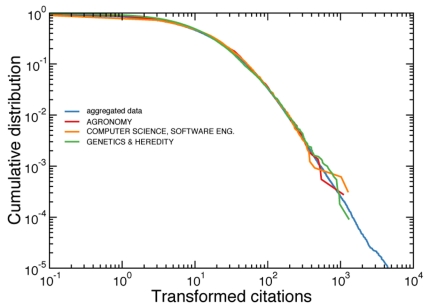
Figure 3. Cumulative distribution of the transformed citation counts.
When raw citation numbers are transformed according to Eq. 2, the cumulative distributions of different subject-categories become very similar. All citation distributions are mapped on top of the cumulative distribution obtained by aggregating all subject-categories together (the common reference curve in the transformation). We consider here the same subject-categories as those considered in Figs. 1 and 2. The complete analysis of all subject-categories and years of publication is reported in the Supporting Information S2, S3, S4, S5, S6, and S7.

