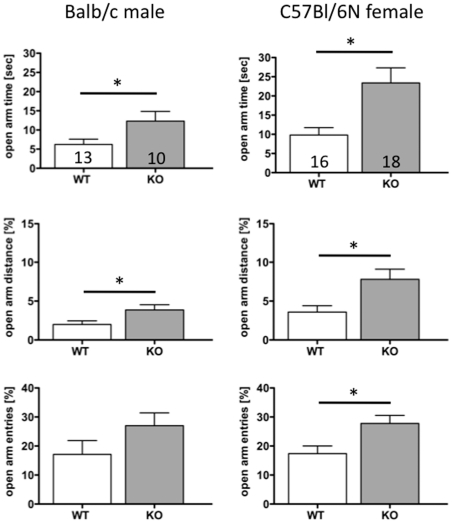
Figure 2. Ambulation on the elevated plus maze by Pdyn KO (shaded bars) and WT (white bars) mice was measured for 5 min.
Time spent (upper row), distance travelled (mid row) and percentage of entries (lower row) onto the open arms are given for male balb/c (left column) and female C57Bl/6N (right column) mice. Data represent mean ± SD of the number of animals indicated in the bars. Student's t test was used to compare the two genotypes. * … p<0.05.

