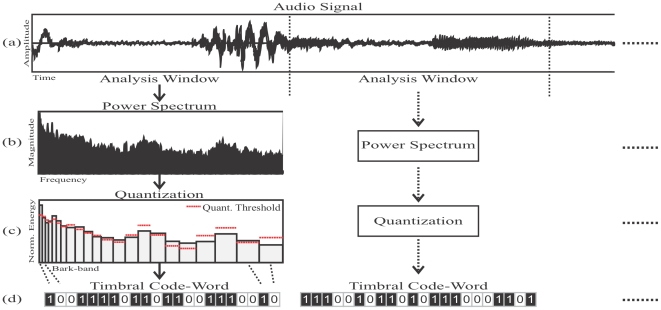
Figure 1. Block diagram of the encoding process.
a) The audio signal is segmented into non-overlapping analysis windows. b) The power spectrum of the audio segment is computed. c) The shape of the power spectrum is approximated by Bark-bands. d) Each Bark-band is binary-quantized by comparing the normalized energy of the band against a pre-computed energy threshold. These 22 quantized bands from a timbral code-word.

