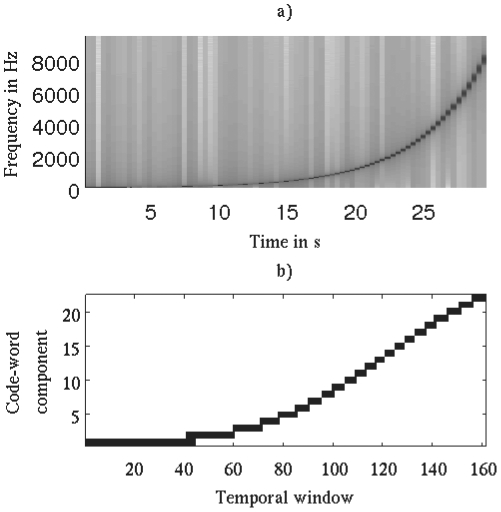
Figure 2. Spectrogram vs. timbral code-word example.
a) Spectrogram representation for a sinusoidal sweep in logarithmic progression over time going from 0 to 9,500 Hz. The color intensity represents the energy of the signal (white = no energy, black = maximum energy). This standard representation is obtained by means of the short-time Fourier transform. b) Timbral code-word representation of the same audio signal. The horizontal axis corresponds to temporal windows of 186 ms and the vertical axis shows the quantized values per Bark-band (black = 1 and white = 0). For instance, in the first 40 temporal windows only the first Bark-band is quantized as one (the first Bark-band corresponds to frequencies between 0 and 100 Hz). A total of 37 different code-words are used to encode this sinusoidal sweep.

