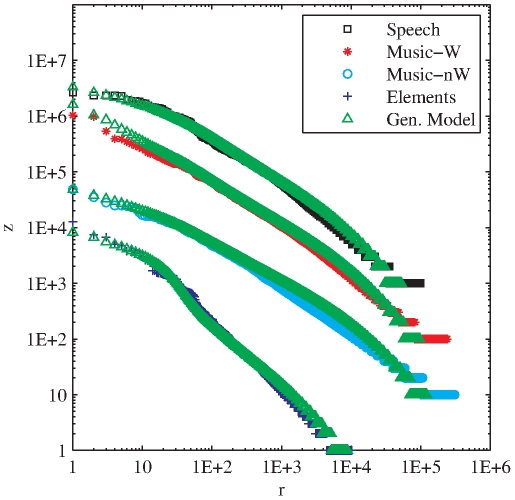
Figure 7. Rank-frequency distribution of timbral code-words (window = 1,000 ms) and Yule-Simon model with memory [13] per database.
Gen. Model stands for the computed generative model. For clarity's sake the curves for non-Western Music, Western Music, and Speech are shifted up by one, two, and three decades respectively. The model's parameters  ,
,  , and
, and  were manually adjusted to match the experimental data. They correspond to the probability of adding a new code-word, the memory parameter, and the number of initial code-words respectively. The adjusted parameters are
  ,
,  , and
, and  for Sounds of the Elements;
  ,
,  , and
, and  for Speech;
  ,
,  ,
,  for Western Music and
  ,
,  , and
, and  for non-Western Music. All model's curves were computed by averaging 50 realizations with identical parameters.

