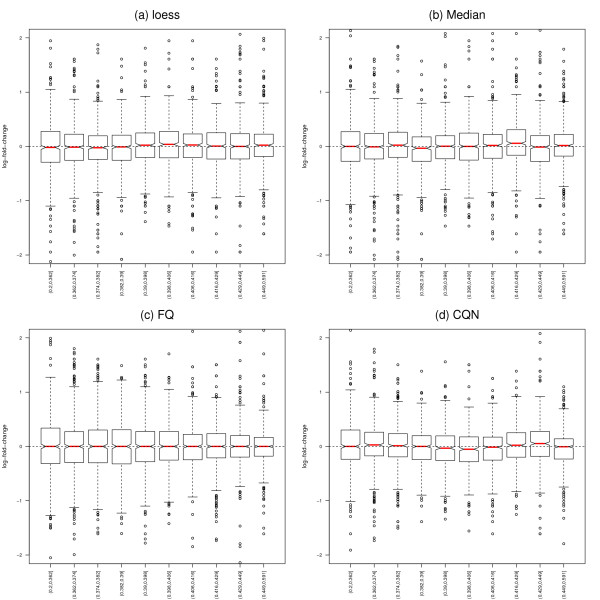
Figure 3.
Yeast dataset: GC-normalized log-fold-change vs. GC-content. Stratified boxplots of count log-ratio vs. GC-content, for the two YPD cultures/library preparations of Figure 2, Panel (b), for four within-lane GC-content normalization procedures. Panel (a): Regression normalization using loess. Panel (b): Global-scaling normalization using the median. Panel (c): Full-quantile (FQ) normalization. Panel (d): Conditional quantile normalization (CQN). The first three within-lane procedures were followed by FQ between-lane normalization; CQN includes its own between-lane normalization. All methods seem to effectively reduce the dependence of fold-change on GC-content (compared to Figure 2, Panel (b)).

