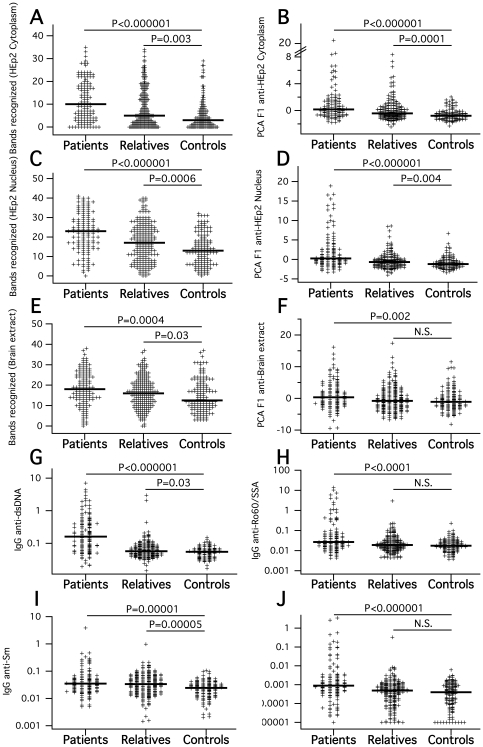
Figure 1. IgG autoreactivities in SLE patients, unafffected relatives and unrelated control subjects.
A–F: Band numbers and 1st principal component calculated from HEp2 anti–cytoplasmic (A,B), anti-nuclear (C,D) and anti-brain (E,F) imunoblot reactivities. G–J: Specific SLE-associated autoreactive IgG quantified by ELISA. All plots show group-wise medians and results of pairwise Mann-Whitney tests for differences between groups.

