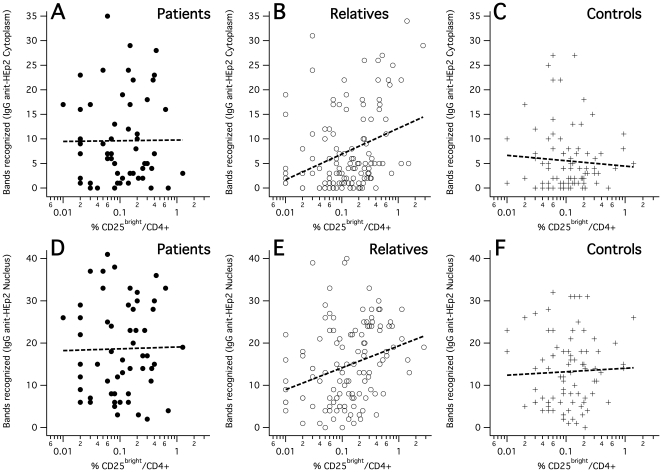
Figure 3. Correlations between CD25bright/CD4+ aTreg frequencies and immunoblot band numbers.
A–C: Bands recognized in immunoblots of HEp2-cytoplasmic proteins by SLE patients, unaffected relatives and unrelated control subjects. D–F: Bands recognized in immunoblots of HEp2-nuclear proteins. Regression lines represent linear regression.

