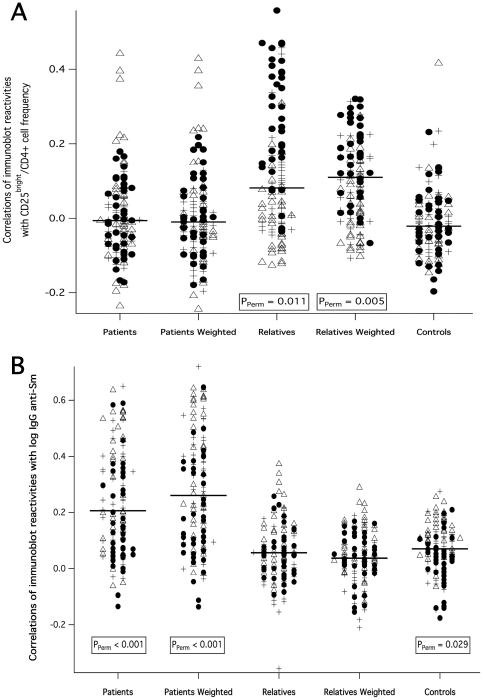
Figure 5. Unweighted and family-weighted correlation coefficients.
Distributions of unweighted and family-wighted correlation coefficients of CD25bright/CD4+ aTreg frequencies (A) and log-transformed IgG anti-Sm (B) with all 130 single immunoblot reactivities are shown within SLE patients, unaffected relatives and unrelated controls, respectively. Reactivities to cytoplasmic bands are indicated by filled circles, anti-nuclear reactivities by triangles and anti-brain reactivities by crosses. Annoteted P-values were calculated by the described permutation test.

