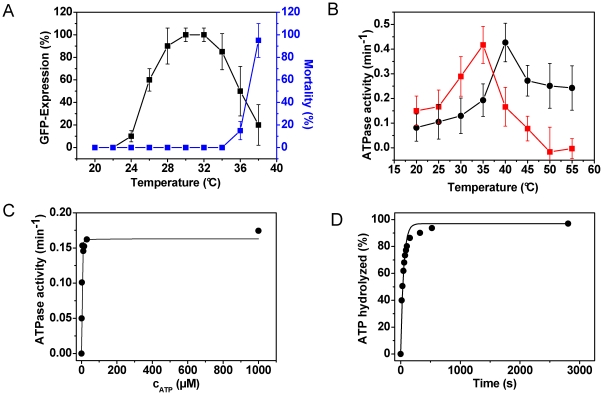
Figure 1. Characterization of CeHsc70.
(A) The induction of the heat-shock response (black squares, left ordinate) was analyzed by exposing a hsp-70::GFP containing C. elegans strain to different temperatures for two hours and scoring after a recovery time of twelve hours. For this experiment nematodes at YA stage were used. The worms were grown at 20°C before shifting them to the respective heat-shock temperature. The percentage of mortality in percent of deceased animals (blue squares, right ordinate) was determined from these samples as well. The values presented are an average of three independent experiments and the error bars represent the standard deviation. (B) The dependence of the ATPase rate of CeHsc70 (red squares) and HsHsc70 (black circles) was determined under steady-state conditions as described in the Materials and Methods section. The values represent the mean of three replicates with the corresponding standard deviation given as errors. (C) Determination of the KM-value of CeHsc70 (•) for ATP in standard buffer at 25°C. Steady-state ATPase activities were determined for CeHsc70 at different ATP concentrations. The data were analyzed as described in the Materials and Methods section. (D) Single-turnover measurement of 20 µM CeHsc70 (•) in the presence of 4 µM ATP in standard buffer at 25°C. Data were analyzed as described in the Materials and Methods section.

