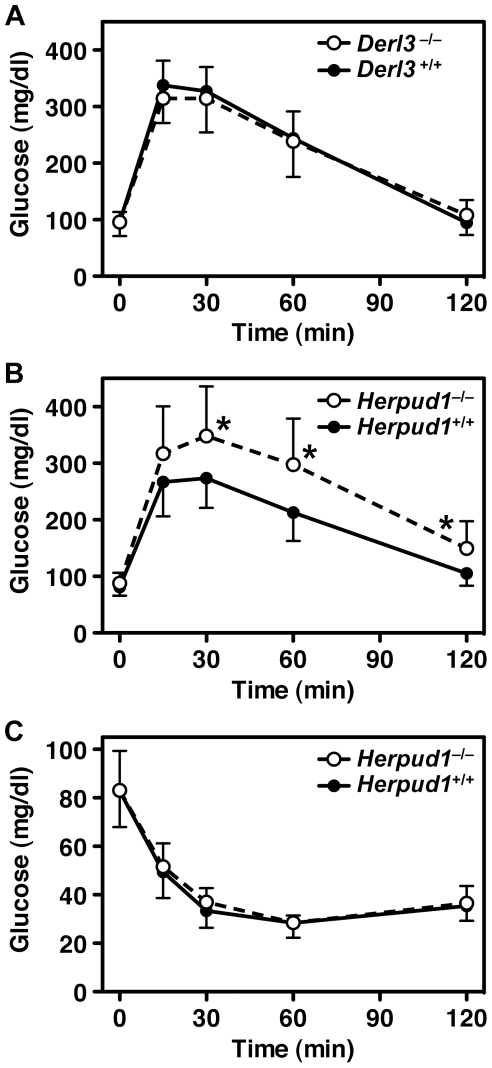
Figure 6. Glucose tolerance and insulin response tests.
Blood glucose levels were examined at the indicated time points after intraperitoneal injection of glucose (A and B) or insulin (C) into Derl3 −/− (A, open symbols), Derl3 +/+ (A, filled symbols), Herpud1 −/− (B and C, open symbols), and Herpud1 +/+ mice (B and C, filled symbols). Data are expressed as the means with error bars of standard deviation (A, n = 12; B, n = 18; C, n = 16). Asterisks indicate p<0.01 (t-test) for Herpud1 −/− vs. Herpud1 +/+ mice.

