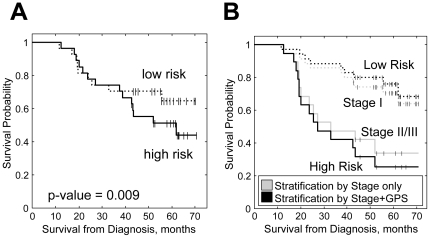
Figure 2. Performance of the Gene Predictive Score (GPS).
A. Kaplan-Meier curves for patients from the test set stratified by the median of GPS calculated from expression of 26 genes. p-value for univariate Cox regression is shown. B. Kaplan-Meier curves comparing survival probabilities for patients from testing set stratified by Stage alone and combination of Stage and GPS with 35 patients in the lower risk group (number of stage I patients) and 19 higher risk group (number of stage II/III patients).

