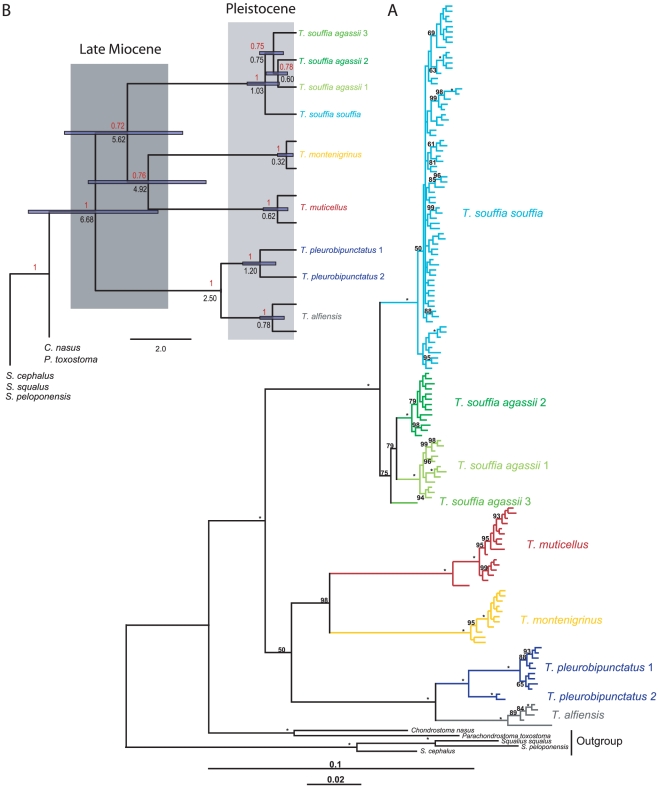
Figure 2. Phylogenetic analyses of mtDNA sequences.
A. Phylogenetic relationships among haplotypes of Telestes hypothesized from Bayesian analysis using 1232 bp of mtDNA. Posterior probability*100 are indicated, with “*” corresponding to pp = 0.1 while “-” are used to indicate pp<0.5. B. Bayesian time calibrated maximum clade credibility tree using relaxed clock with the same dataset but selected terminals representing major lineages. The calibration point used was the divergence between T. pleurobipunctatus and T. alfiensis. Posterior probabilities are indicated in red on the upper left of the nodes while the modes of the posterior distributions of the age of the nodes are indicated in Myr on the lower left in black. 95% CI are indicated with blue bars centered on the nodes.

