Figure 5. Bayesian clustering analyses of microsatellites using Structure.
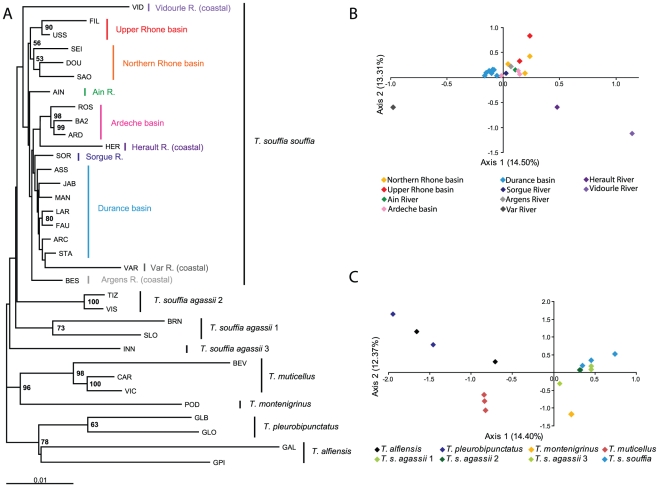
Estimated population structure for population samples representative of Telestes genus (A) and T. s. souffia (B). “*” indicates K values retained from ΔK [67] and ΔFst [64] tests and when maximizing the posterior probability value [60]. Between parentheses, the number of convergent runs associated to the structure displayed.

