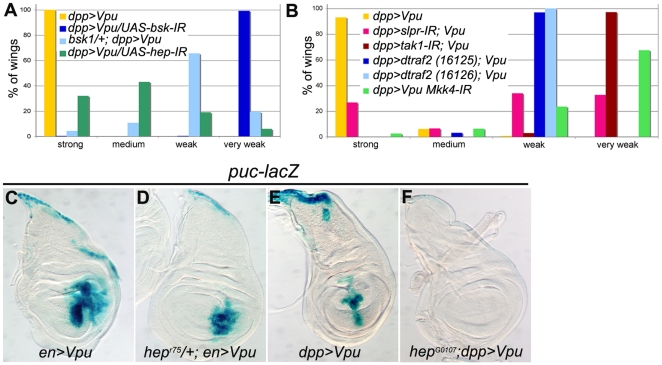
Figure 8. Vpu activates the JNK pathway in wing cells upstream of hep.
(A) Phenotypic distributions (as %) of wings of the indicated genotypes. The distributions observed when bsk (dark and light blue) or hep (green) are down-regulated are statistically different (Chi2 test) from the reference distribution (yellow, n = 282): p = 7.8 10−112 with UAS-bsk-IR (n = 223) and p = 1.2 10−56 with UAS-hep-IR (n = 187), and (yellow n = 403): p = 1.5 10−90 with bsk1/+ (n = 93), respectively. Flies were raised at 26°C. (B) Phenotypic distribution (as %) of wings of the indicated genotypes. Three independent experiments are shown but, in each case, the phenotypic distribution of wings in the control (*, **, *** see below) is identical for each set of experiments. The distributions observed with (1) RNAi-mediated knockdown of slp and tak1 (pink and brown, respectively) are each statistically different (Chi2 test) from the reference distribution (yellow*; n = 222 and n = 220, respectively): p = 8.2 10−43 with UAS-slpr-IR (n = 168) and p = 4.3 10−82 with UAS-tak1-IR (n = 169), (2) two UAS-traf2-IR insertions are statistically different from the reference distribution (yellow**; n = 258): p = 1,9 10−87 with UAS-traf2-IR (light blue VDRC16125; n = 159) and p = 5,3 10−72 with UAS-traf2-IR (dark blue VDRC16126; n = 64), (3) RNAi-mediated knockdown of Mkk4 (green, n = 267) is statistically different from the reference distribution (yellow***; n = 251): p = 1,4 10−96. (C–F) puc-lacZ expression (X-gal staining) in wing imaginal discs of en-Gal4/+; UAS-Vpu/+ (C) and hepr75/+; en-Gal4/+; UAS-Vpu/+ (D) females and of dpp-Gal4 UAS-Vpu/+ (E) and hepG0107/Y; dpp-Gal4 UAS-Vpu/+ (F) males. Larvae were raised at 22°C since the hepG0107/Y mutant is lethal before the third larval instar at a higher temperature.

