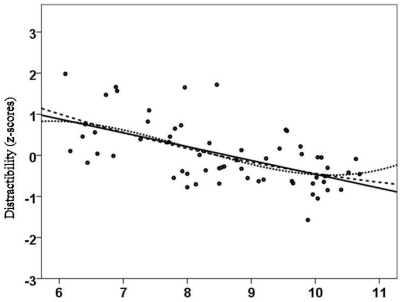
Figure 2. Correlation between age (yrs.) and distractibility as assessed by the KITAP [18] , [33].
A linear trend was indicative of a reduction in distractibility with increasing age. There was no quadratic trend, and a cubic trend was indicative of a plateau (decrease – plateau) for ages greater than 10 years.

