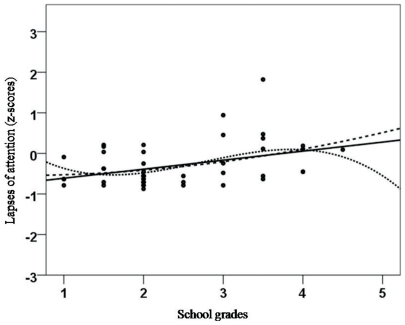
Figure 4. Correlation between scholastic achievement (school grades in German) and the z-scores of lapses of attention as assessed by the KITAP [18] , [33].
A linear trend was indicative of an increase in lapses of attention with a decline in school grades (1 = “very good”; 6 = “worst”), and a quadratic and cubic trend was indicative of a plateau starting between the school grades 1 and 2.

