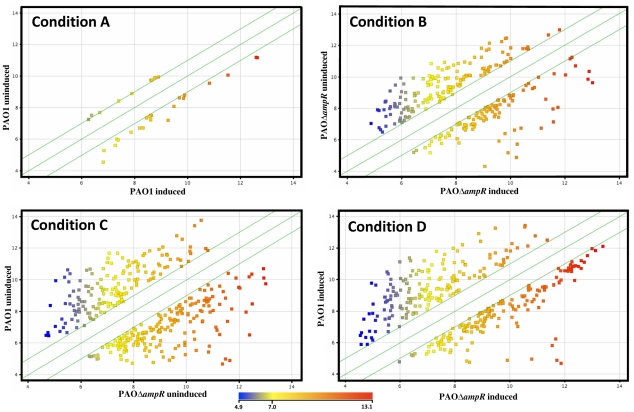
Figure 3. Scatter plots of significantly regulated genes.
Only genes that showed significant (p≤0.01) differential regulation under the various conditions are depicted as colored squares. The colors represent the extent of gene expression from low (blue) to high (red) in either condition, as depicted in the color scale. The two outer green diagonal lines in each plot represent the two-fold cutoff. Each sub-plot depicts the differential gene expression between two strains/conditions (shown along the plot axes): Condition A- PAO1 uninduced vs. PAO1 induced; Condition B- PAOΔampR uninduced vs. PAOΔampR induced; Condition C- PAO1 uninduced vs. PAOΔampR uninduced; Condition D- PAO1 induced vs. PAOΔampR induced.

