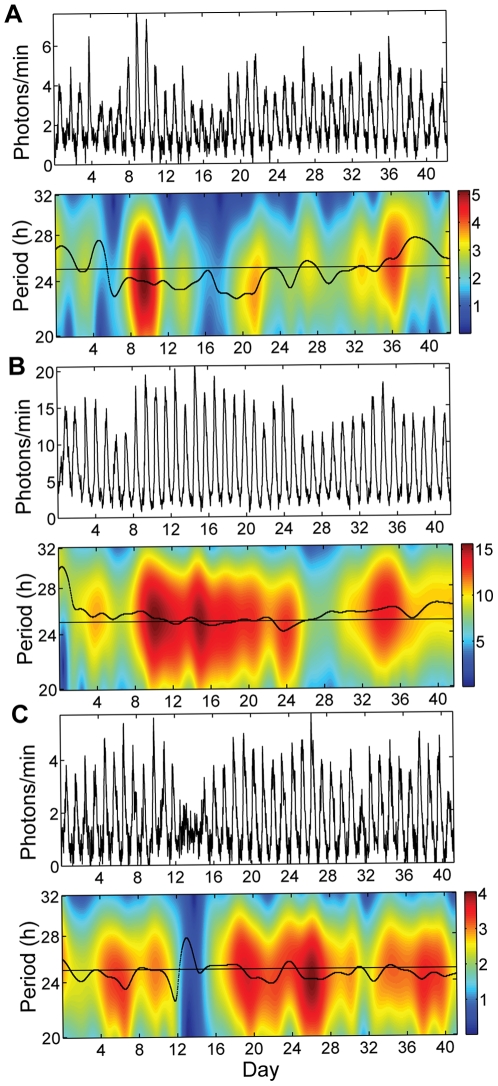
Figure 1. Examples of fibroblast PER2::LUC recordings.
The time series for each example is shown above the corresponding analytic wavelet transform (AWT) to illustrate the variability over time in period and amplitude. Period as a function of time is indicated by the black ridge curve, while amplitude is indicated by the color scale (in photons/min). A line at period 25 h is included for reference. (A) Typical cell #11, cell area 1.12×104 µm2, period 24.3 h with CV 0.067, amplitude 2.94 photons/min with CV 0.35. Note that red in the AWT corresponds to cycles with high amplitude, yellow those with moderate amplitude, and blue those with low amplitude. Period variability is indicated by the black ridge curve moving up and down over time. (B) Large cell #25, cell area 1.74×104 µm2, period 25.3 h with CV 0.030, amplitude 12.2 photons/min with CV 0.23, exhibiting steady rhythms, with both amplitude and period varying less than in (A). (C) Cell #36 with strong oscillations except for a pause on days 13–14 (reflected by the blue region of the AWT), cell area 8.36×103 µm2, period 24.8 h with CV 0.055, amplitude 2.93 photons/min with CV 0.27.

