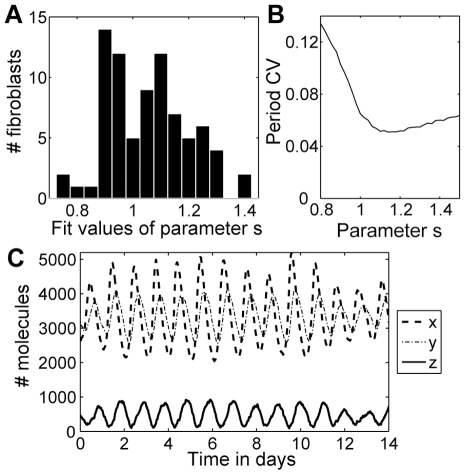
Figure 7. Stochastic modeling.
(A) Results from fitting the fibroblast data to the stochastic model, as described in Methods. Fit values with the parameter s<1 indicate that the oscillations are noise-induced (the deterministic system would be steady state), while fit values with s≥1 indicate that the oscillations are self-sustained. (B) Results of simulations of the stochastic model for different values of the parameter s, fixing the amplitude of z to be 500 molecules (by adjusting the value of Ω with respect to s). The mean value of the period CV over 500 simulations is shown for each value of s. The period CV is minimized for s in the range 1.1–1.2. (C) Example of a stochastic simulation with s = 1.03, where Ω is chosen so that the amplitude of z is 500 molecules. The period CV for this simulation is 0.073.

