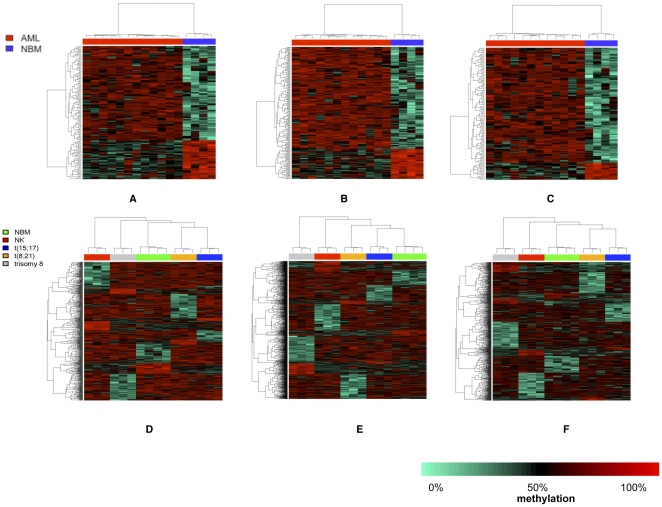
Figure 3. Hierarchical clustering of AML versus NBM in the interspersed repeats.
In each figure, each column represents AML patient/NBM and each row represents a single DMR. First row represents cluster analysis of all AMLs versus all NBMs and the second row represents cluster analysis of AML subtypes in SINEs (A, D), LINEs (B, E) and LTRs (C, F). Distinctive hypomethylated SINEs, LINEs and LTRs clearly distinguished each AML subtype (second row).

