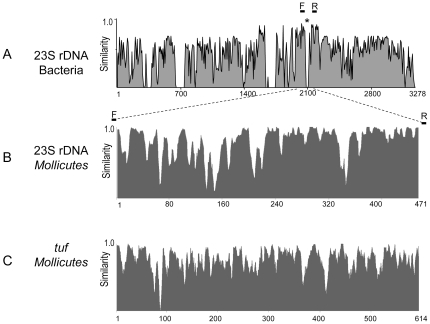
Figure 1. Sequence similarity plots of the target regions used in the present microarray.
Numbers on the abscissa denote positions in the sequence alignment. The diagrams were produced using Vector NTI 11 and are based on alignments of A) complete 23S rRNA genes of 10 selected eubacterial species and 9 mycoplasmas (asterisk showing the location of the 23–26-nt deletion found in all Mollicutes spp.), B) the 471-nt signature region of all 44 mycoplasmas included in this study (alignment in File S2), and C) the central 614-nt region of the tuf gene of 43 mycoplasma species (alignment in File S3). Bars denoted F and R indicate the positions of forward and reverse primers, respectively, that were used for amplification. MVW 1–3 indicate the positions of most variable windows.

