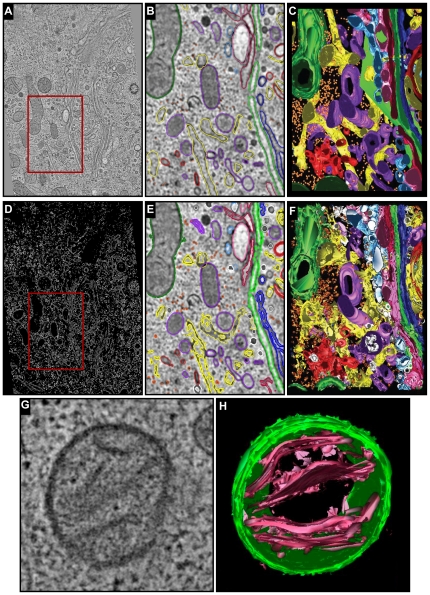
Figure 5. Segmentation of the Golgi region of an insulin-secreting pancreatic beta cell line HIT-T15.
(A) A tomographic slice (slice 33) extracted from the reconstructed volume reported in [23]. The region demarcated by a red box is shown in (B). (B) Objects were segmented by manually drawing colored lines (contours) using IMOD. (C) Surface-rendered 3D model of the Golgi region analysed in (B) by manual segmentation. (D) 3D BLE-filtered tomogram. (E) Contours detected automatically by the 3D BLE were then manually colored for comparison to the manually segmented volume shown in (B). (F) Surface-rendered 3D model generated by automatic segmentation of the same region shown in B. Coloring in (C–D) and (E–F) is as follows: the seven cisternae that comprise the Golgi in the region - C1, light blue; C2, pink; C3, cherry red; C4, green; C5, dark blue; C6, gold; C7, bright red. ER, yellow; membrane-bound ribosomes, blue; free ribosomes, orange; mitochondria, bright green; dense core vesicles, bright blue; clathrin-negative vesicles, white; clathrin-positive compartments and vesicles, bright red; clathrin-negative compartments and vesicles, purple; mitochondria, dark green. (G) A tomographic slice revealing the outer and inner membrane architecture of a mitochondrion in the Golgi region. (H) Surface rendering shows that automated 3D segmentation facilitated by the application of 3D BLE detects the mitochondrial membranes.

