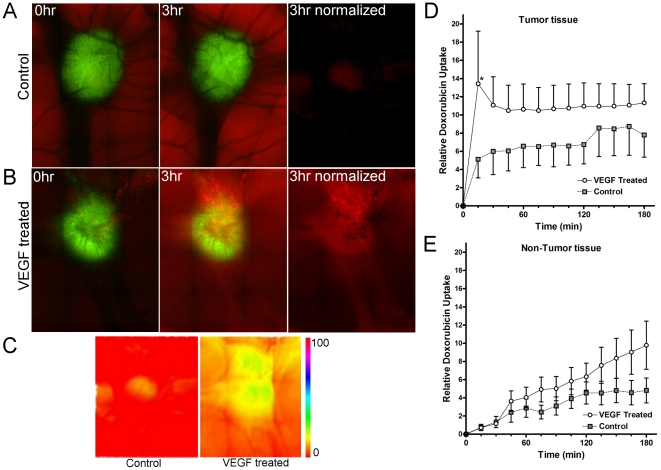
Figure 4. Increasing vascular permeability enhances the accumulation of doxorubicin into the tumor.
Doxorubicin was injected intravenously subsequent to administration of PBS or VEGF and its uptake at the tumor site in real time was estimated using its natural fluorescence. A–B. Representative images of doxorubicin uptake over time, tumors (green) and doxorubicin uptake (red) are shown. C. Heat map of doxorubicin uptake after 3 hours in control and VEGF-treated tumors. D. Graph showing relative uptake of doxorubicin in the tumor in the presence or absence of systemic VEGF treatment. E. Graph showing relative uptake of doxorubicin in the normal tissues distal to the tumor in the presence or absence of systemic VEGF treatment. N = 4 per treatment; data were analyzed by 2 way ANOVA.

