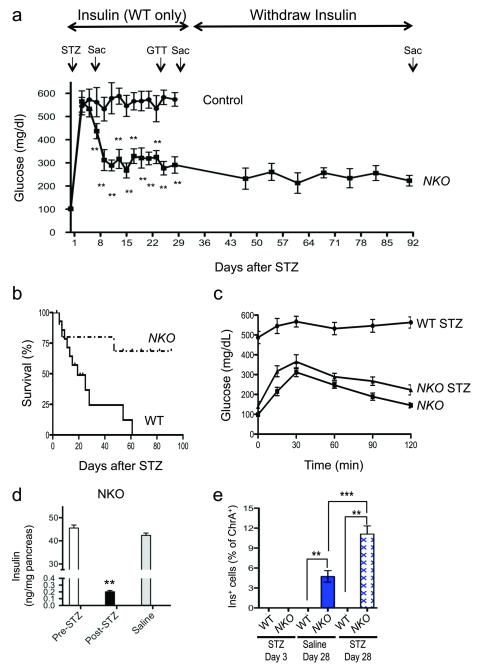
Figure 4.
Regeneration of gut Ins+ cells following STZ-mediated ablation. (a) Fed glucose levels in NKO (squares) and control mice (circles). Arrows indicate timing of STZ administration (STZ) and killing (SAC). Insulin (2-4 U/kg/day) was administered to control mice from day 3 to day 28 (n = 16). (b) Survival plots of NKO and WT mice following STZ. (c) Oral glucose tolerance tests in NKO mice before and after STZ administration (day 20), and in WT controls following STZ (day 20). (d) Pancreatic insulin content of NKO mice pre- or post-STZ (black bar), or saline injection (n = 4). (e) Quantification of gut Ins+ cells in WT and NKO mice at day 3 and day 28 post-injection, in animals treated with saline (blue bar), or STZ (hatched pattern). * = P < 0.05, ** = P < 0.01, *** = P < 0.001. Error bars indicate SEM.

