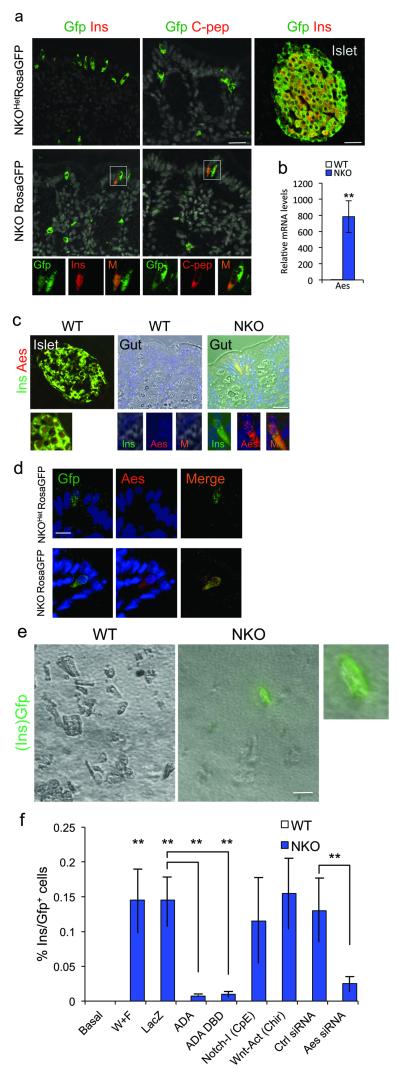
Figure 6.
Lineage tracing of Ins+ cells and Aes expression. (a) Immunohistochemistry with Gfp (green) and insulin or C-peptide (red) in WT islets, WT gut, and NKO:Rosa26eGfp gut. Gfp+/Ins+ or Gfp+/C-peptide+ cells are indicated in rectangles. (b) qPCR of gut Aes mRNA sampled from gut segments enriched with Ins+ cells and anatomically matched specimens from WT controls (n=4). (c) Islet and gut immunohistochemistry with insulin (green) and Aes (red) in NKO and control mice. (d) Gut immunostaining with Gfp (green) and Aes (red) in NKO:Rosa26eGfp and WT mice. (e) Gfp direct fluorescence of primary gut cells isolated from NKO:Ins2-Gfp or Ins2-Gfp control mice and cultured in Wnt3a- and Fgf4-containing medium for 4 days. (f) Quantification of Ins2-Gfp cells in differentiation assays. With the exception of basal conditions, all treatments included Wnt3a and Fgf4 (W+F), and were further subjected to viral transduction (LacZ, Foxo1-ADA, or Foxo1-DBD-ADA), or Notch inhibitor (Compound E), or Wnt agonist (sc222416), or siRNA. No Gfp+ cells from Ins2-Gfp control mice were observed in any condition (white bars). Blue bars indicate counts of Gfp+ cells in cultures from NKO:Ins2-Gfp mice. Data indicate means ± SEM from 3 independent experiments. Scale bars: 40 μm (a, c), 30 μm (e), and 20 μm (d). * = P < 0.05, ** = P < 0.01.

