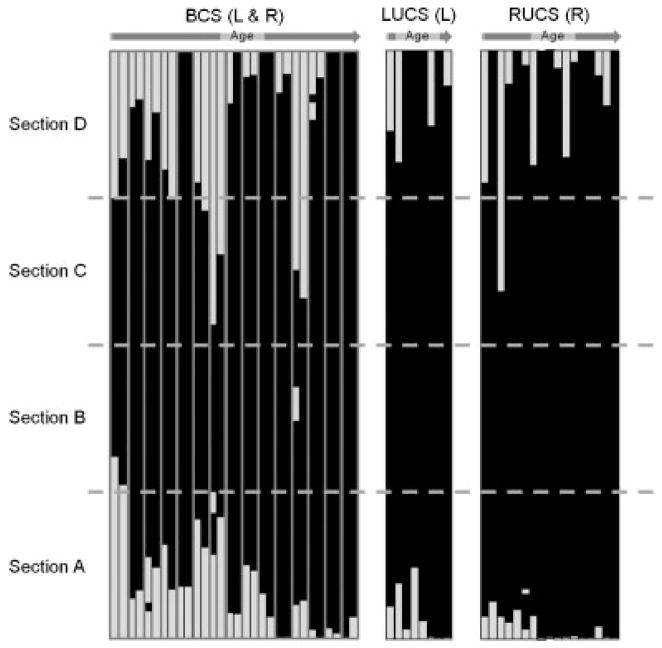
Figure 3.
Coronal suture fusion patterns by phenotype and age. Each bar represents one side of the coronal suture. For the BCS cases, each doublet of bars represents the left, then right suture (the two bars corresponding to one individual being framed in grey). Only the affected side is shown for the UCS cases. The white and black sections represent the slices where the coronal suture was patent and fused, respectively. Though coronal suture can be represented by 20 or 100 slices depending on the CT slice thickness, all bars have been resized to a common height.

