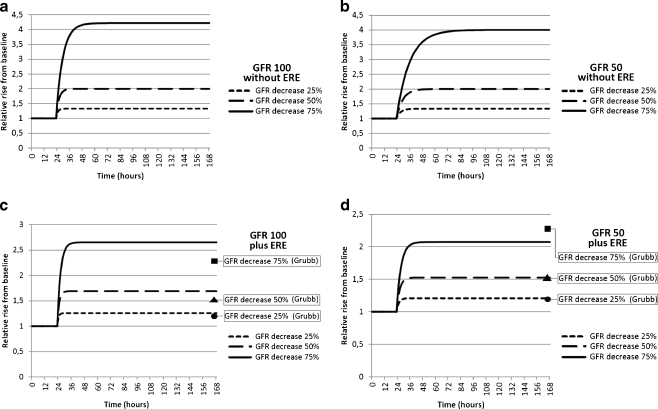
Fig. 3.
a, b, c, and d Pharmacokinetic models illustrating the relative rise of cystatin C above baseline at different levels of glomerular filtration rate (GFR) in time. Course of calculated cystatin C concentrations following an acute decrease in GFR at time 24 h at two different levels of GFR. Presentation of the relative rise compared to baseline corresponds to a GFR of 100 ml/min/1.73 m2 (Fig. 3a and c) and a GFR of 50 ml/min/1.73 m2 (Fig. 3b and d). In Fig. 3c and d, the extrarenal elimination (ERE) of cystatin C (i.e., 22 ml/min/1.73 m2) is taken into account. For comparison, the relative rise of cystatin C calculated according to the Grubb equation is indicated in Fig. 3c and d

