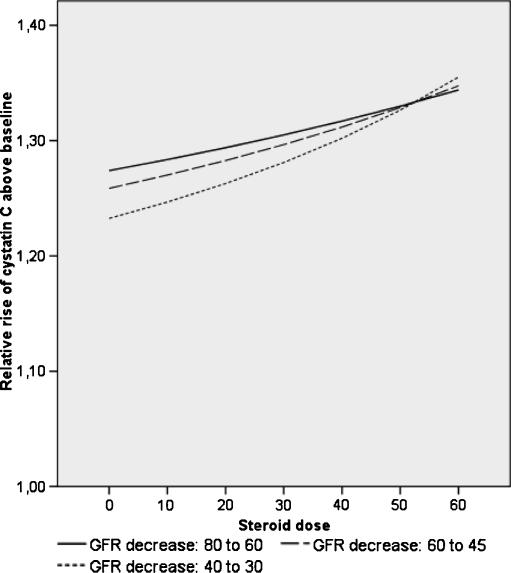
Fig. 4.
Model illustrating the effect of corticosteroids on the relative rise of cystatin C above baseline at different levels of glomerular filtration rate (GFR). Calculation of cystatin C concentrations correspond to three different baseline GFR levels and a decrease by 25% (RIFLE ‘R’) using the Grubb equation. Correction for the dose-dependent increase in serum cystatin C caused by glucocorticoids using the equation 1/cys = 0.0096 * GFR – 0.0023 * prednisone dose (mg/m2/day) [33]

