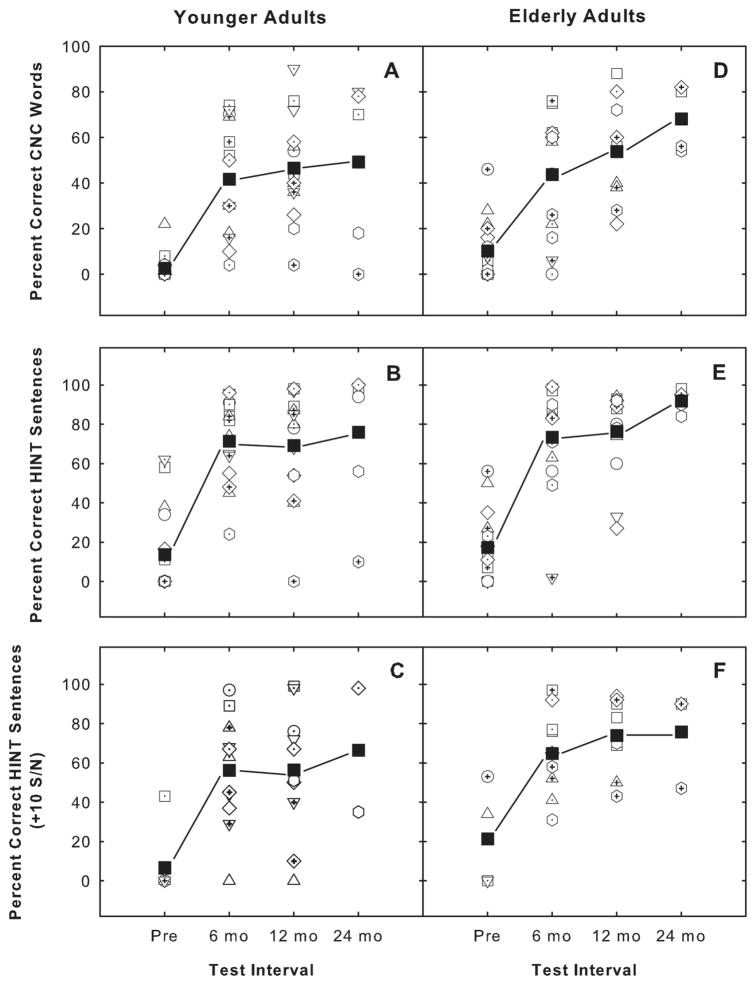
Fig. 1.
Auditory-only speech recognition scores, (i.e., Hearing In Noise sentence Test and Consonant-Nucleus-Consonant data) for the two groups of participants as a function of testing interval. Results from the 39- to 53-year-old group (A, B, and C), and results from the over 65-year-old group (D, E, and F are shown). Each open symbol represents data from one study participant. The solid square at each testing interval represents the mean score.

