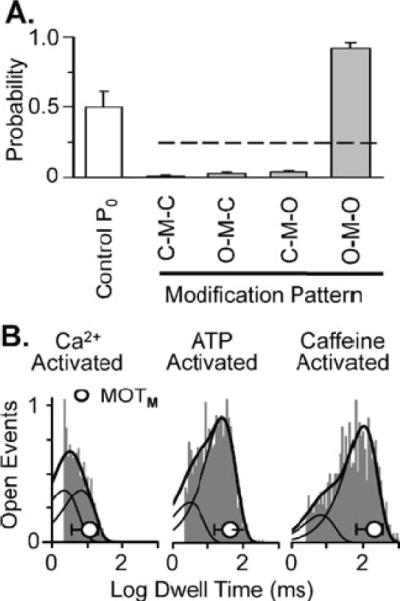
Fig. 3.

Ryanodol acts on open RyR2 channels. a Probability of different patterns of ryanodol modification. Individual ryanodol-modifications (n=385) from 22 different RyR2 channels were analyzed. These data were collected at 20 mV in the presence of 40 μM ryanodol. Open bar represents average Po during unmodified periods (0.49±0.11). Individual drug modification events were classified into four different categories (O–M–O, C–M–C, O–M–C, and C–M–O). The O refers to the fully open state. The C refers to the fully closed state. The M refers to the drug-modified state. The dashed line represents the 0.25 probability level. b Representative open dwell time histogram collected from a Ca2+, an ATP, or a caffeine-activated channel. These data represent open dwell times to the fully open state during unmodified periods. Histograms were fit by two exponential components. Solid cureve represents the sum of the two components. The dashed curves represent the individual components. The mean open time of full conductance openings immediately preceding the ryanodol modification (MOTM ± SD) in each case is superimposed on each histogram (open circle). For the Ca2+-activated channel, τ1 was 3.6 ms, τ2 was 11.0 ms, and MOTM was 11.4±7.9 ms. For the ATP-activatcd channel, τ1 wras 7.3, τ2 was 59.6 ms. and MOTM was 43.7±28.0 ms. For the caffeine-activated channel, τ1 was 16.2,τ2 was 239.9 ms, and M0TM was 208.1±144.7 ms
