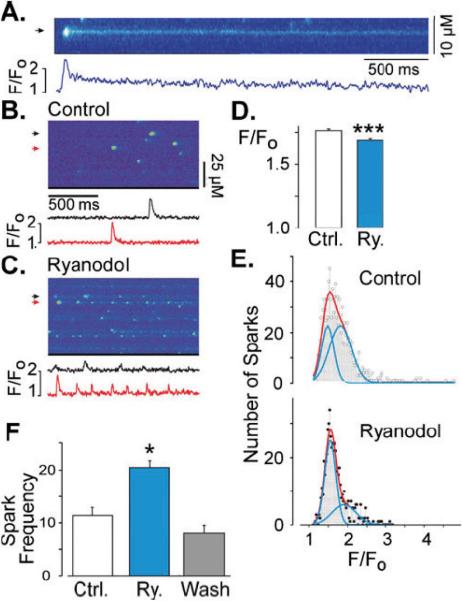
Fig. 4.
Ryanodol action on Ca2+ sparks in permeabilized myocytes. a Line scan image of a Ca2+ spark recorded in a permeabilized cardiac myocyte perfused with 10 μM ryanodine. Shown below is a fluorescence profile trace (F/FO; F = fluorescence signal, F0 = basal fluorescence) at the position marked by an arrow. b Control line scan image recorded in a permeabilized cell showing spontaneous Ca2+ sparks. Shown below are fluorescence profiles at the positions marked by the color-coded arrows. c Line scan image recorded from the same myocytc as in b but now during perfusion with 50 μM ryanodol. Again, fluorescence profiles are shown below. d Bar graph indicating the average Ca2+ spark amplitude recorded in control (white bar, n=1044 Ca2+ sparks, 12 cells) and after ryanodol treatment (blue bar, n=644 Ca2+ sparks, 9 cells). Triple asterisks indicate p<0.00.1. e Frequency histograms of Ca2+ spark amplitude (F/F0) recorded in control (top) and after ryanodol treatment (bottom). Red lines are double-Gauss fits. Blue lines are the individual Gauss functions. Fitting of the control histogram revealed peaks at 1.5 and 1.8 (F/F0), R=0.9387). Fitting of the ryanodol histogram revealed peaks at 1.55 and 1.9 (R=0.9471). This indicates that ryanodol decreased average spark amplitude by increasing the propoition of smaller amplitude Ca2+ sparks. Note that the control histogram could be well fit by a single-Gaussian function (R=0.971), but the ryanodol histogram was poorly fit by a single-Gaussian function (R=0.665). Thus, double-Gaussian fits were used in both cases. f Bar graph demonstrating the reversibility of ryanodol action on spark frequency. Single asterisk indicates p<0.05

